
The Overview
About
Leading end-to-end UX strategy for Ontario's government digital services — from North Star visioning workshops with senior leadership to a Power BI executive dashboard that tracked service delivery outcomes in real time.
COMPANY:
PwC
ROLE:
Senior UX Lead
SECTOR:
Service Design
TIMELINE:
8 Weeks
TOOLS:
Figma
The Challenge
Ontario's government services needed a human-centred overhaul
ServiceOntario — the province's primary gateway for citizen services — faced growing pressure to modernise. Citizens were navigating fragmented, inconsistent experiences across channels, and the organisation lacked a unified vision to guide investment priorities and service improvement.
PwC was engaged to define a Customer Experience (CX) Framework from the ground up: a North Star vision, guiding principles, service blueprint, and a measurable roadmap to move ServiceOntario from its current state to a future of seamless, equitable, and proactive service delivery.
The problem for citizens
Residents had to repeat their information across multiple touchpoints. Transactions were slow, averaging 62 minutes per interaction, with 3+ channel transfers per customer journey.

The problem for the organisation
No shared vision or guiding principles across divisions. Decision-making on investment and service priorities lacked a consistent CX framework to anchor it.

MY ROLE
Leading design from strategy to delivery
I joined this engagement as the senior UX lead at PwC, working directly with ServiceOntario's leadership and cross-functional teams. My remit spanned the full project — from facilitating executive workshops to designing the data visualisation layer that would make outcomes trackable.
What set this engagement apart was the stakeholder complexity. I was presenting to Assistant Deputy Ministers (ADMs), facilitating alignment sessions with division heads, and coordinating daily with PwC strategy, data, and technology colleagues — all while ensuring the design work remained grounded in real citizen needs.

The Design Process
8 weeks, end to end

The Design Work
Key choices and trade-offs
Principles as navigation
I designed the 6 CX guiding principles as interactive filter pills at the top of the dashboard — not just labels. This meant leadership could instantly see the entire programme through the lens of any single principle, connecting strategy to data in one click.
Hybrid workshop design
The North Star workshop had both in-person and virtual participants across government divisions. I designed the session flow to give equal voice to remote attendees — dedicated virtual facilitators, parallel digital boards, and structured turn-taking to prevent in-room bias.
Outcomes, not outputs
Early drafts tracked project deliverables (outputs). I pushed for a redesign centred on citizen outcomes — transaction time, channel transfers, client identification rates — making the dashboard meaningful to both programme managers and ADMs.
Clients only tell us once
The core design principle I advocated for throughout — "customers and businesses only have to tell us once" — became the anchor outcome across all 4 interconnected principles, ensuring every design decision mapped back to reducing citizen effort.
Power BI Executive Dashboard
One of my key deliverables was designing the executive dashboard that would give ServiceOntario leadership real-time visibility into how well the transformation programme was tracking against its CX goals. I was responsible for the information architecture, layout, and interaction design — working with the data team to ensure the visualisation accurately reflected the underlying metrics.
SCREEN 1
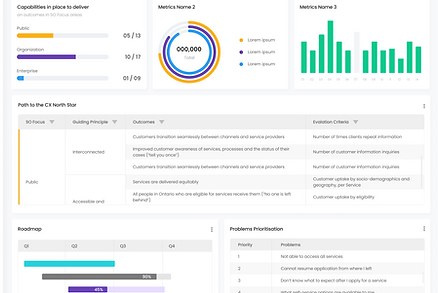
Executive overview
The dashboard was designed to let leadership filter by guiding principle and immediately see which outcomes were on track, at risk, or lagging. The key challenge was translating abstract CX principles into concrete, trackable metrics — a problem I solved by working with stakeholders to define measurable proxy indicators for each principle.
.png)
.png)
SCREEN 2
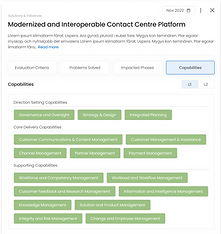
Solutions & initiatives tracker
Designed a weekly progress tracker that let programme managers drill into specific solutions (e.g. "Modernized and Interoperable Contact Centre Platform") and view outcomes achieved vs. budget spent across a 4-week rolling view. The "Impacted Phases" section showed how each solution affected the overall transformation roadmap, enabling leadership to make informed prioritisation decisions.
.png)
.png)
.png)
The Outcomes

Impact at a glance
8 weeks
End-to-end delivery timeline
25%
Increase in user engagement
ADM
Level stakeholders aligned
3
Core framework delivered
What we delivered
01
CX Framework adopted
A full North Star CX Framework — vision, 6 guiding principles, outcome definitions, and capability maps — endorsed by ServiceOntario ADMs and used to anchor future investment decisions.
02
End-to-end service blueprint
A complete front-to-back service blueprint mapping 16 touchpoints across two citizen journeys, with full traceability from strategy to individual project deliverables.
03
Executive dashboard live
A Power BI dashboard that gave leadership real-time visibility into CX outcomes, solution progress, and budget performance — replacing manual reporting with a single source of truth.
04
Organisational alignment
Brought together 6+ government divisions around a shared CX vision for the first time, with ADM sign-off achieved within the 8-week engagement window.
Skills Demonstrated
Workshop facilitation
Data visualisation
Cross-functional leadership
Stakeholder management
Power BI design
Executive communication
Service design
CX strategy
Information architecture
Government / public sector

